Everyone knows volunteer organizations thrive because of champion volunteers who put in more time than the rest of us. They are passionate, they are responsible, and they are absolutely the foundation of the entire volunteer program. But we wanted to know exactly what percentage of volunteers actually do the majority of the volunteering.
Given that we’ve been collecting data for 5 years now, we’ve combed through over 1.5 million volunteer hours of our top 500 volunteer organizations, and we found that on average, 15% of volunteers do the majority of the volunteering.

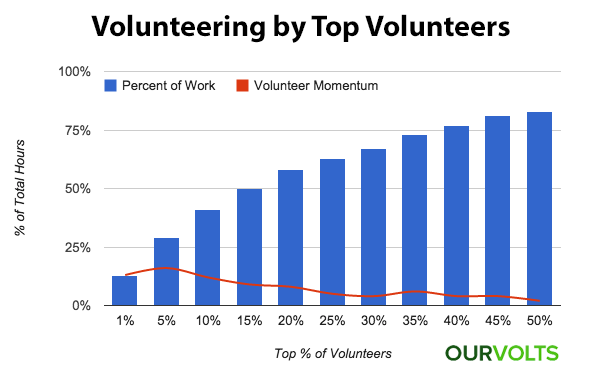
In the above chart, you can see the top 1% of volunteers end up doing 13% of the total hours of work, and 15% of the volunteers do 50% of the total hours, etc.
Now take note of that red line. It represents the difference between the percentage of total hours between each interval ( for the fellow data nerds out there, it’s the derivative ). We’re going to call that “volunteer momentum.”
Here are some interesting points you can draw from the above chart:
- 15% of volunteers do the majority (50%) of the volunteering
- The latter 50% of volunteers only do 20% of the volunteering
- The top 5% of the volunteers have the highest “volunteer momentum” and pull in 28% of all the volunteering.
When we charted all this data, I was impressed, but what actually surprised me was that some of the individual organizations that comprised the average volunteer momentum looked very different from one another.

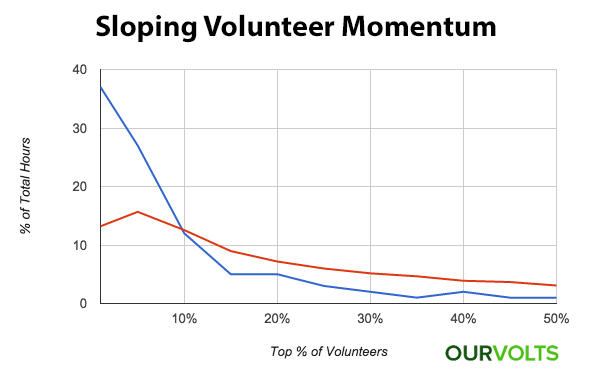
The organization represented by the blue line is a park where volunteers are allowed to volunteer any time they want. They volunteer because they love their park, they love their community, and they love the work they’re doing. The more they volunteer, the bigger impact they create. This trend is most common in organizations that empower their volunteers to volunteer as much as possible, such as gardens, parks, community efforts, religious institutions, and animal shelters.
However, the volunteer momentum drastically lowers and continues to dip below the average volunteer momentum rate. A question I wondered: why is the volunteer momentum so low for the remaining 90% of volunteers? Here are my initial guesses:
- new volunteers are not nurtured and don’t have enough incentive to invest a significant amount of time
- the champions overshadow the other volunteers, not leaving much room for them to grow
- the type of volunteer who becomes a champion loves what they’re doing but is very hard to find
- the champions are simply volunteering so much that it makes everyone else other look like they’re doing less, even though they are doing an impressive amount of volunteering
Now let’s take a look at organizations that have a flatter ‘volunteer momentum’ rate:

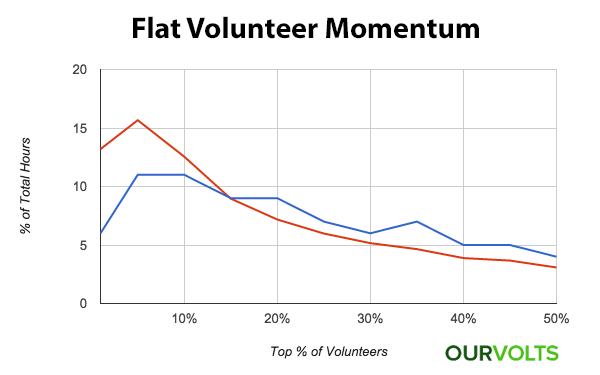
This organization represented by the blue line is a school that requires parents to volunteer to have their student enroll. Other organizations like this all require volunteer hours in exchange for something: charter and private schools, service clubs, universities, and museums. The momentum is a bit flatter since individuals have a fixed goal, but there is still a clear spike in momentum in the top 5-10% of volunteers. It seems that there are always those top volunteers that invest a significant amount of time helping their organizations.
Despite engagement being very high, there are potential downsides of requiring volunteer hours:
- Creating a clear “carrot” is not easy for all organizations, and if it does not resonate with your volunteers, it may push some away
- Having required hours can put a ceiling on the amount of work volunteers do, inadvertently not encouraging volunteers to go above and beyond
- Accurate accounting will become necessary to audit all the hours
Conclusions
Not all organizations can have all the same incentives or requirements for their volunteers, but one thing that remains the same is that they are dependent upon those top ‘champion’ volunteers. Regardless of the type of organization, it seems that these champions should be nurtured, but also inspired and encouraged to motivate the rest of the volunteers. And at all costs, losing a champion should not be taken lightly. For example, most organizations depend on a couple major financial donors for their operating budget - imagine if that donor decided to move on to a different organization. Wouldn’t you want to prevent that too?
Next time on our blog, we’re going to dive into a case study of one organization where one of their champions stopped volunteering, and we’ll explore the impact it created and find out how they had to bounce back.
If you want to see more data around volunteering, subscribe below. And if you have any comments, suggestions, arguments, questions, or requests for specific topics or data, feel free to leave a comment below!
 Last updated by